Test Execution Duration Analysis#
Test Case Execution Duration Analysis report provides advanced information on test case durations by calculating key execution time metrics such as average, median, and 95th percentile (P95). By emphasizing these duration metrics, the report efficiently identifies slow-performing test cases and gives insights into the test execution results both for all the test cases and for each test case separately.
Generating the report#
In order to generate the Test Case Execution Duration Analysis report, you should go to the Reports section and select the corresponding report type from the library.
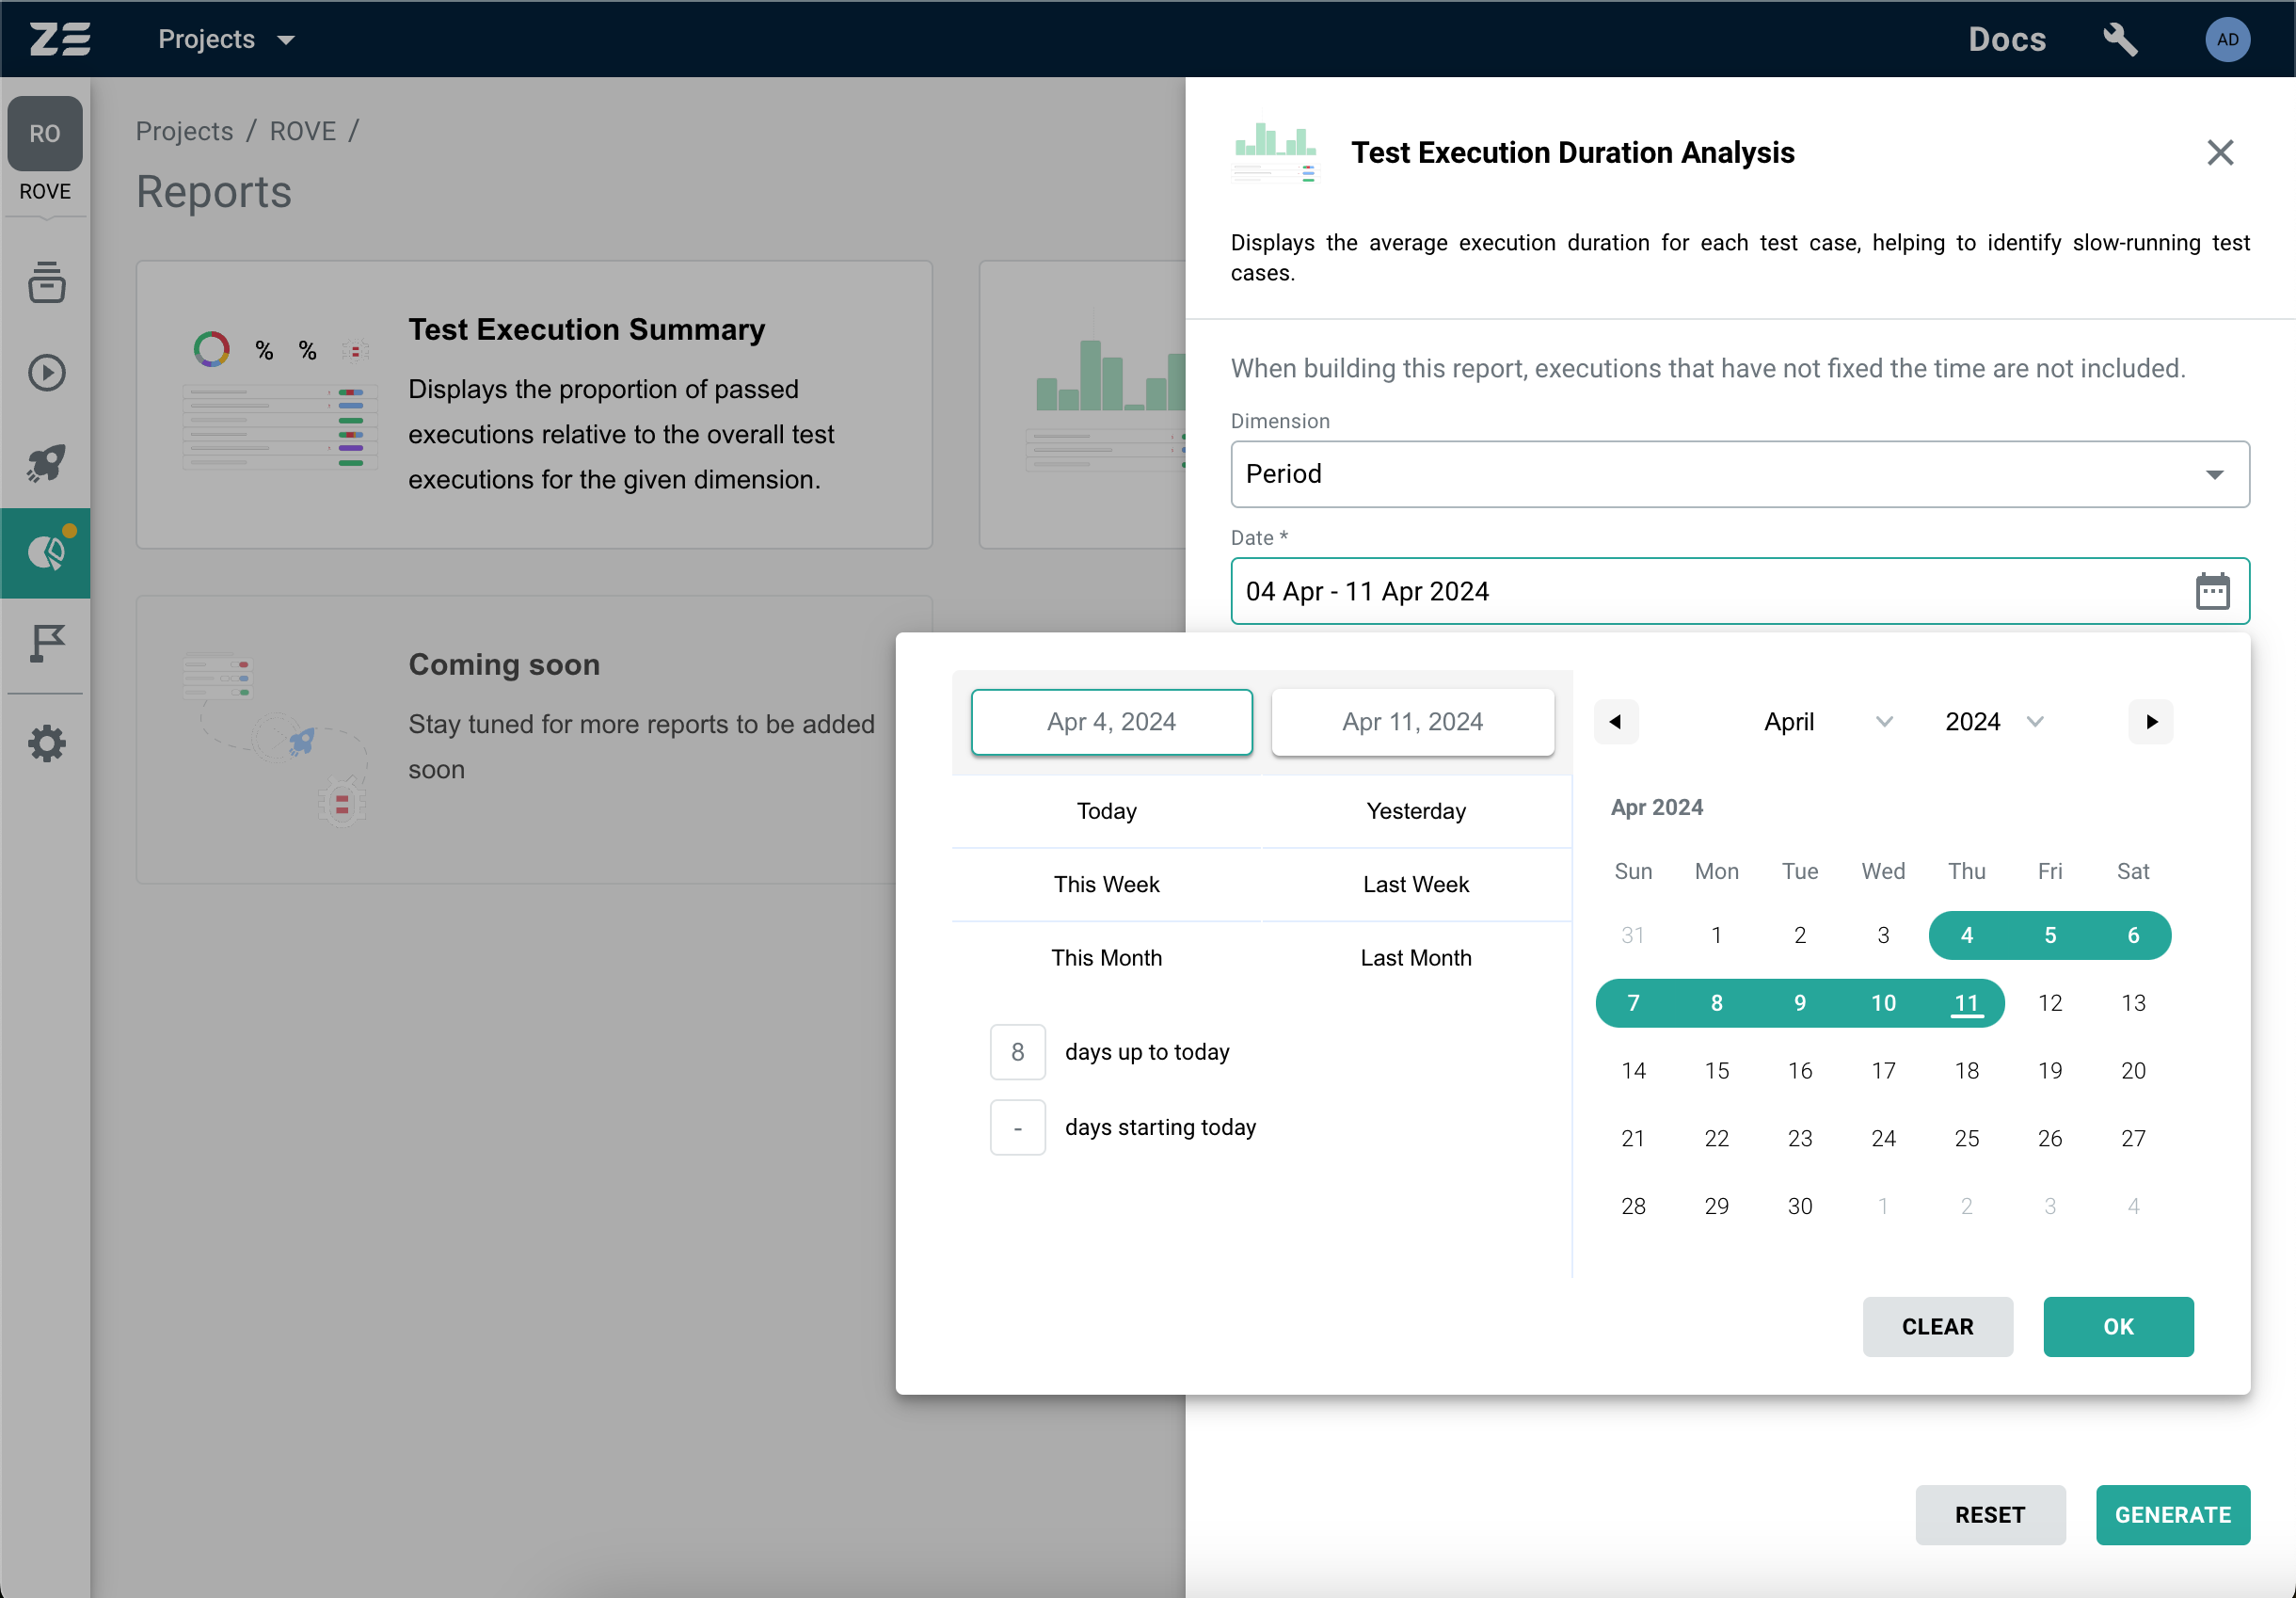
As a first step, select the Dimension that will be used to narrow down test executions selection for the report. There are two dimensions that are currently supported: Period and Milestone. The Period dimension will include in the report all test executions that happened within the selected period. The Milestone dimension will include only those test executions that occurred in scope of test runs associated with the selected milestones.
Once you have selected the dimension and configured it, click Generate button to generate your report.
Info
This report only includes test executions that have execution time.
Report data#
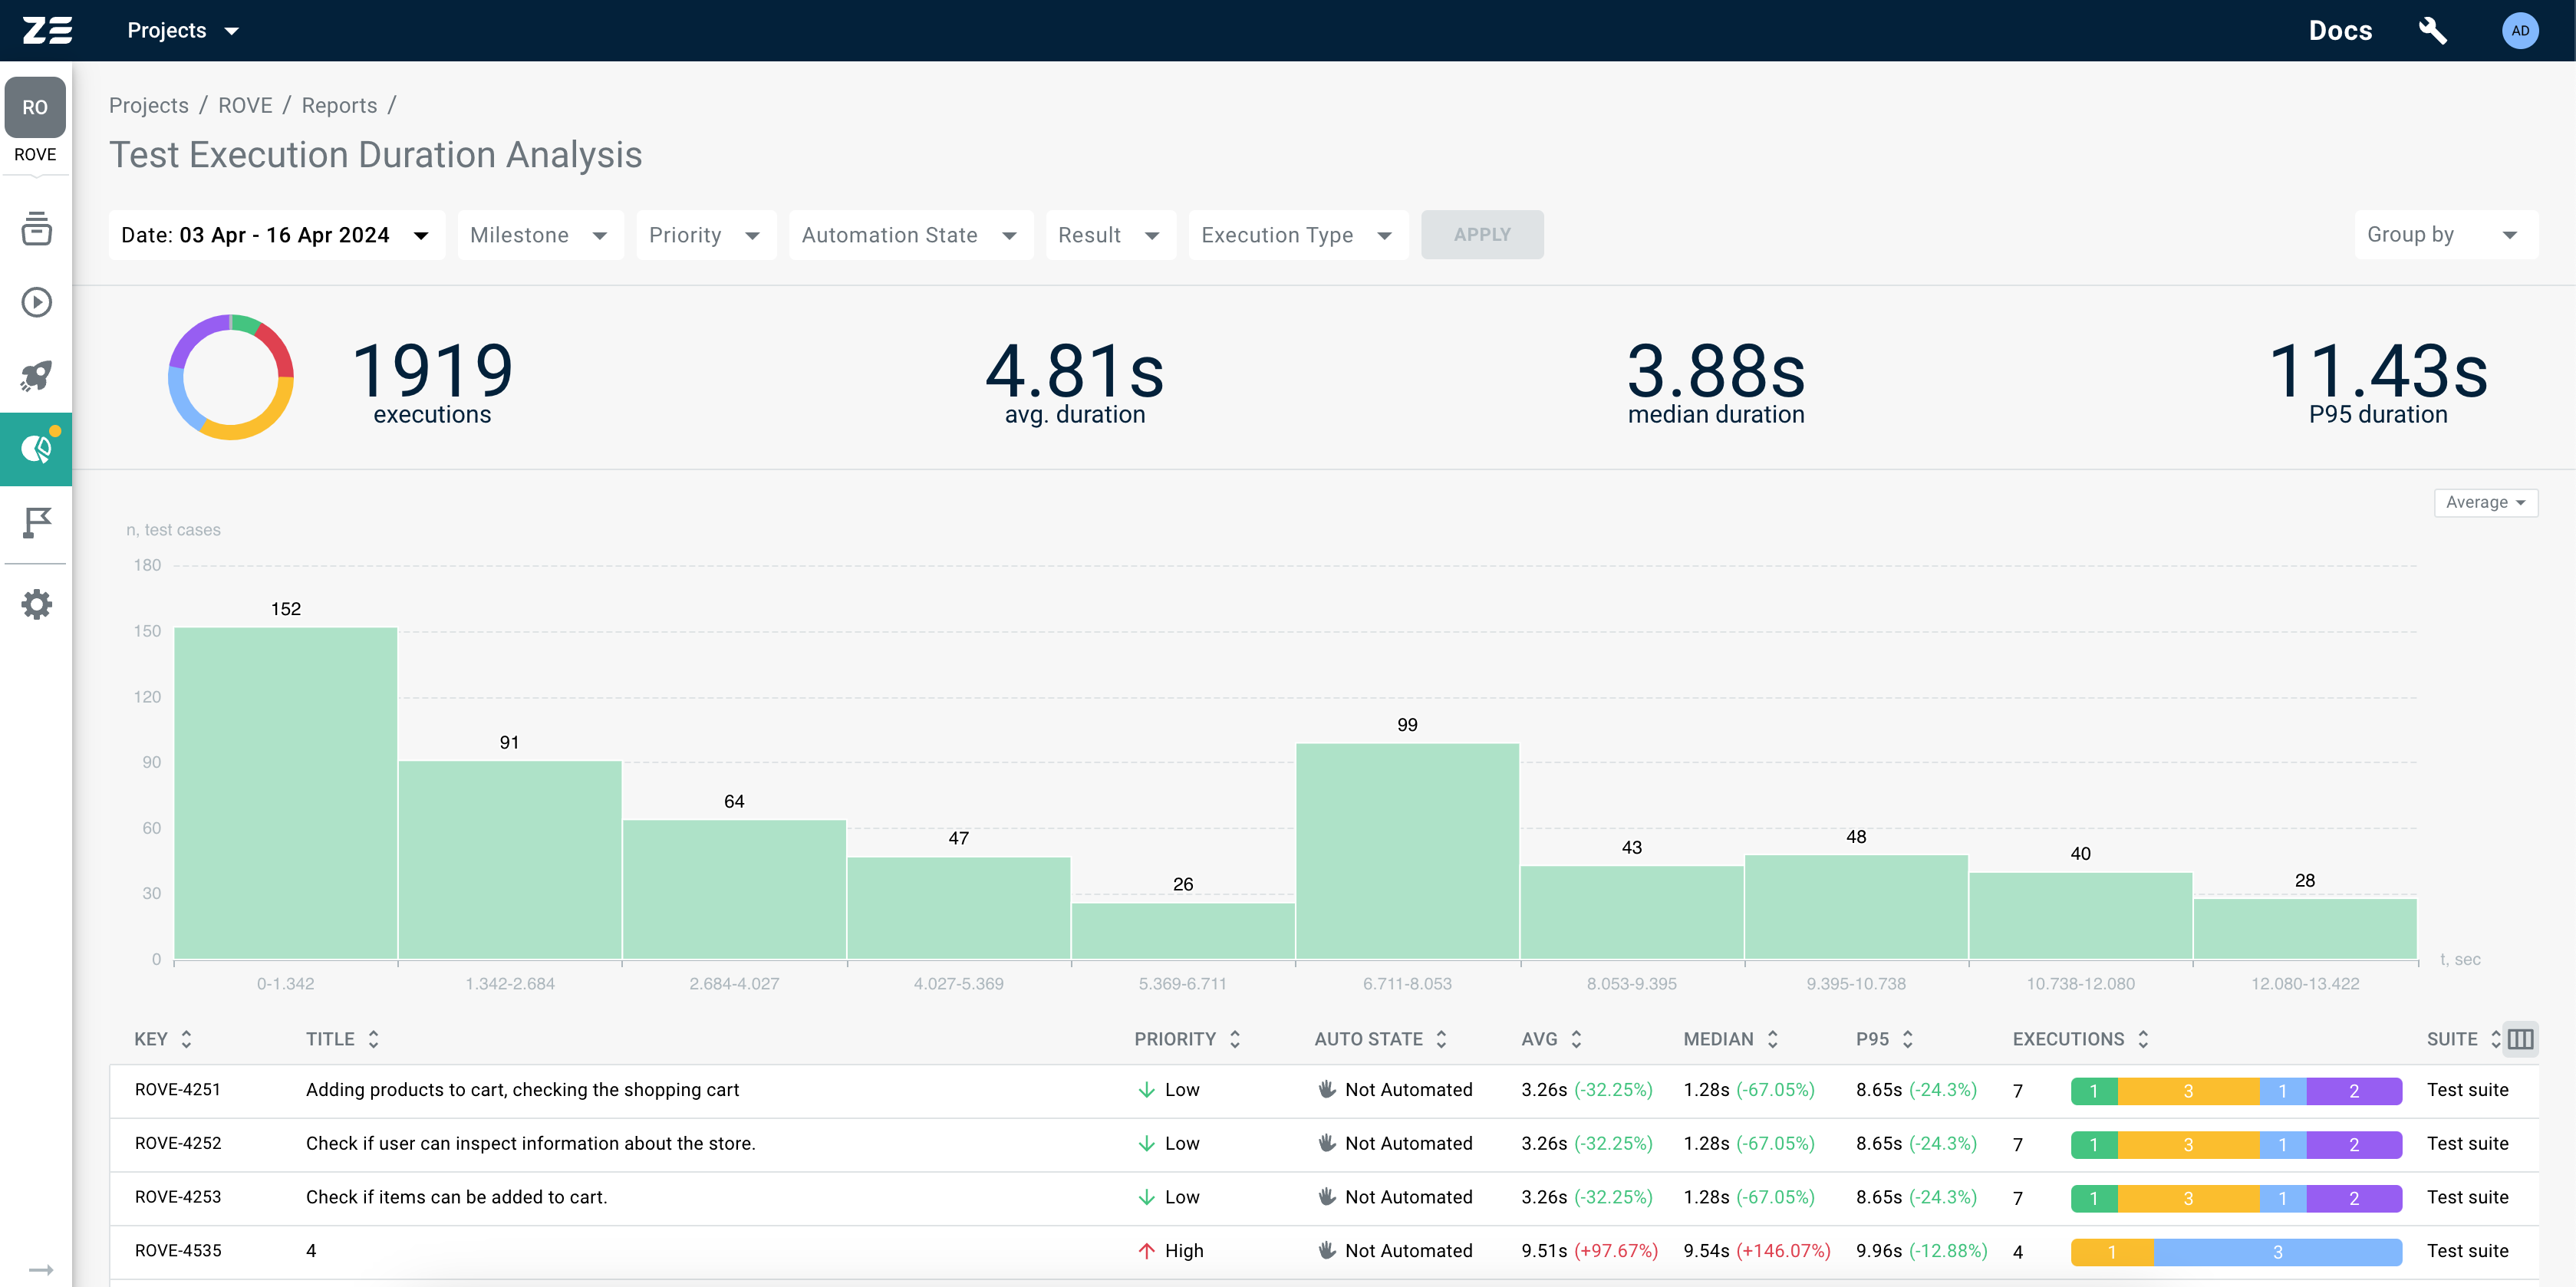
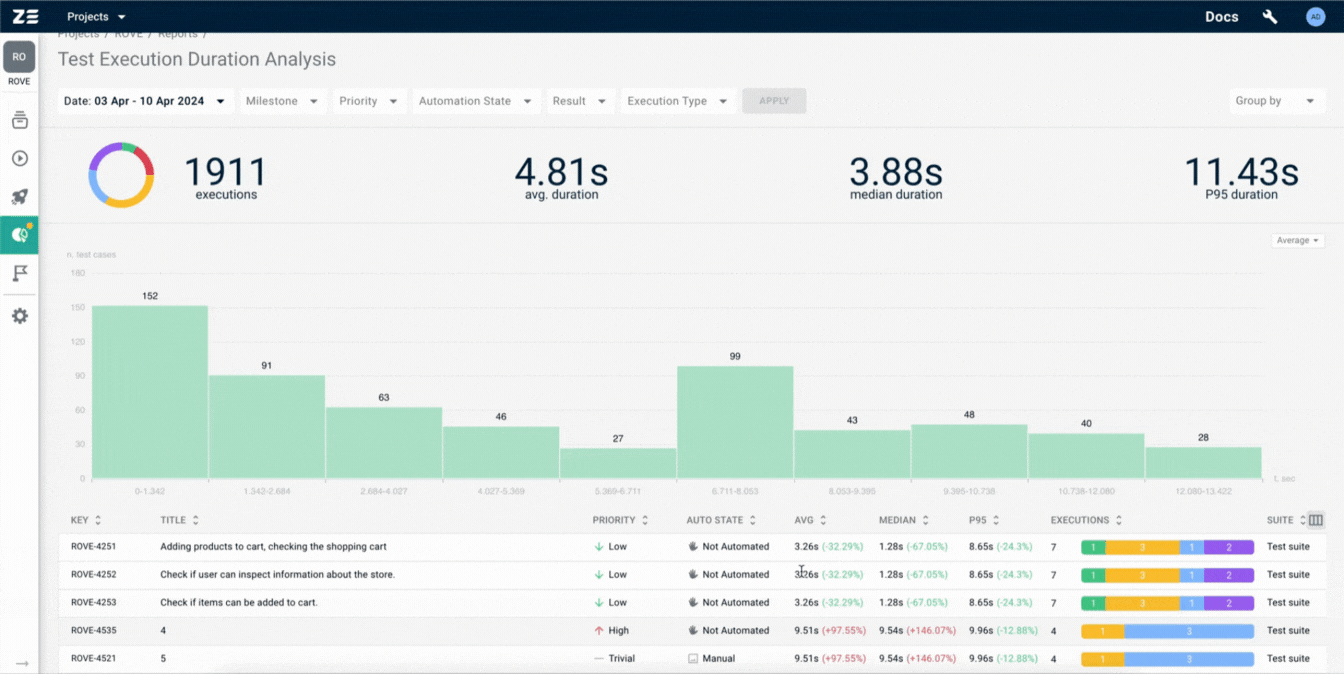
Once the report is generated, the following data will be available in the report's header:
- Execution results donut chart: interactive chart allowing you to see test execution results distribution;
- Number of executions: total number of executions that were used to generate the report;
- Total average duration: average execution duration of all selected test cases;
- Total median duration: median execution duration of all selected test cases;
- Total P95 duration: 95th percentile of execution duration of all selected test cases.
A table with execution statistics for each test case will follow the header. This table will contain key test case attributes (its key, title, test suite, priority and automation state) along with some aggregates on execution data (its average, median, p95 execution time, and execution results summary bar).
Duration chart#
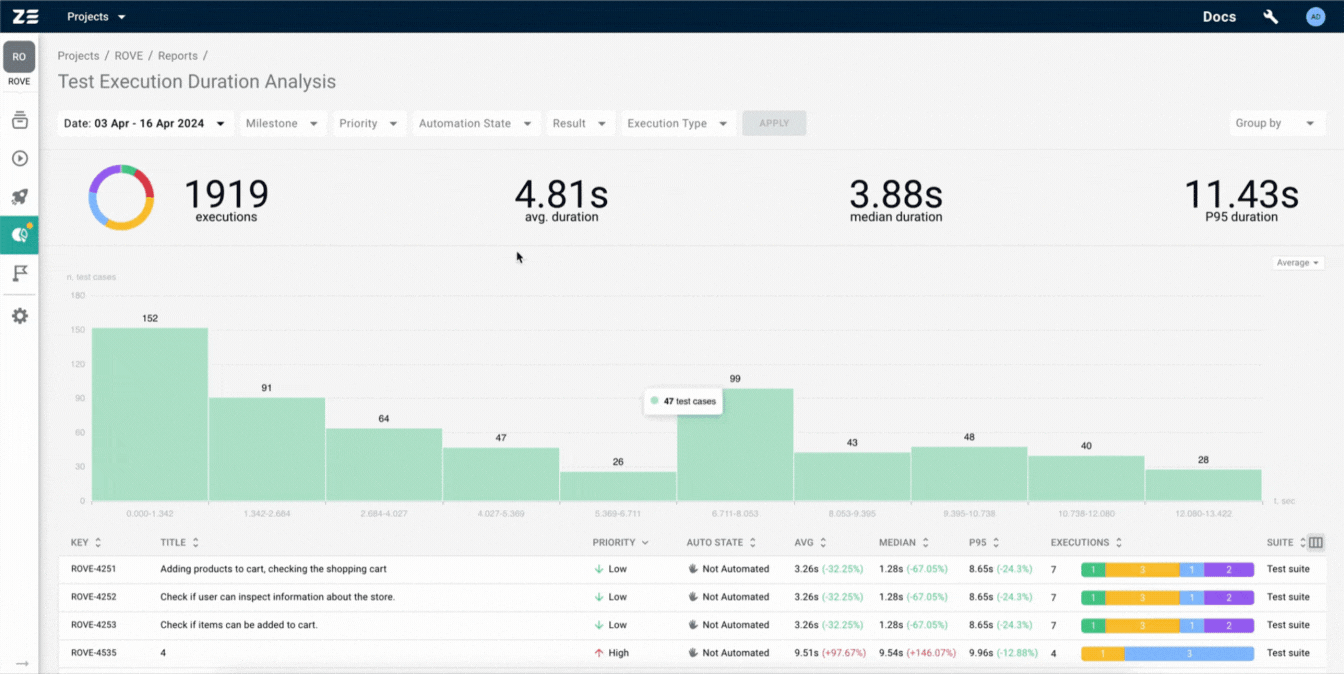
The key feature of the report is its graphical representation of test case durations aggregations (average, median, p95). This report utilizes histograms to display test case durations segmented into intervals, highlighting key duration metrics.
By emphasizing duration metrics through graphical visualization, this report efficiently identifies slow-performing test cases that may benefit from automation or refactoring.
Note
The duration chart is interactive, allowing you to engage with the data more dynamically. By clicking on a specific interval within the histogram, you can instantly filter and view the test cases associated with that selected duration range.

Report capabilities#
The Test Case Execution Duration Analysis report provides several options for manipulating and customizing the displayed data.
Filtering#
The report offers a range of filters to refine and focus the displayed data based on specific criteria:
- Date - mandatory, if the Milestone filter is not used. It allows selection of all test executions happened within the specific time period;
- Milestone - mandatory, if the Date filter is not used. It allows you to include only those test executions that occurred in scope of test runs associated with the milestones;
- Priority - allows filtering based on the priority level assigned to test cases (e.g., High, Medium, Low);
- Automation state - allows filtering test cases based on their automation states (e.g., Automated, Manual);
- Result - allows filtering based on the result of test case executions (e.g., Passed, Failed));
- Execution type - allows filtering based on the type of test execution (Manual, Automated)).
Note
When filters are applied, they are automatically saved to the URL. Thereby, you can share the link to the report or add it to bookmarks without losing filters.
Grouping#
Test Case Execution Duration Analysis report provides the ability to group test cases using various criteria:
- Suite - test cases are grouped based on their test suite. This grouping allows for a holistic view of test case execution performance within specific functional areas or modules;
- Priority - test cases are grouped according to their priority (e.g., High, Medium, Low). This grouping helps identify and analyze the execution duration trends based on the criticality of test cases;
- Automation state - test cases are grouped based on their automation status (e.g., Automated, Manual). This grouping allows users to evaluate the impact of automation on test case execution duration and overall testing efficiency.
Note
When grouping is applied, it is automatically saved in the URL. Thereby, you can share the link to the report or add it to bookmarks without losing grouping.

Configuring table columns#
Columns of the table with test cases can be configured: it is possible to show or hide columns and rearrange their order. In order to do so, you can use the control in the top right corner of the table:
Note
When the configuration changes, it is automatically saved in the URL with the column order preserved. Thereby, you can share the link to the report or add it to bookmarks without losing the columns order.